Research Interests
Tumor biology
Glioblastoma multiforme SYGNAL Network (gbmSYGNAL)
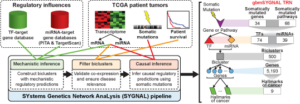
Regulatory influences from target gene databases and patient tumor data (from The Cancer Genome Atlas (TCGA)) are analyzed sequentially in three steps by a suite of interconnected algorithms in the Systems Genetics Network AnaLysis (SYGNAL) pipeline. The gbmSYGNAL TRN was constructed by using the SYGNAL pipeline to analyze tumor biopsy data from 422 patients with different subtypes of GBM. The resulting TRN is a predictive map that implicates specific somatic mutations in causally modulating the expression of a TF(s) or miRNA(s) that in turn regulates genes (within a bicluster) that are putatively associated with a hallmark of cancer. A summary of the counts for each feature in the gbmSYGNAL TRN is shown in the figure below on the left.
- Reference: Plaisier et al., 2016 Cell Systems
- Preview of reference: Brooks et al., 2016 Cell Systems
- gbmSYGNAL website
- TF target gene database
Pan-Cancer
- Cross cancer miRNA regulatory network
The cancer miRNA regulatory network (CMRN) was constructed by inferring miRNA mediated regulation for 2,240 gene co-expression signatures from 46 cancer transcriptome profiling studies. The cancer miRNA regulatory network can be used to identify clinically relevant miRNAs that are candidates for improved diagnostics, prognostics and therapeutics.

- Reference: Plaisier et al., 2012 Genome Research
- CMRN website
- miRvestigator website
- miRvestigator reference: Plaisier et al., 2011 NAR
- The Immune Landscape of Cancer: SYGNAL-PanImmune Network
A joint e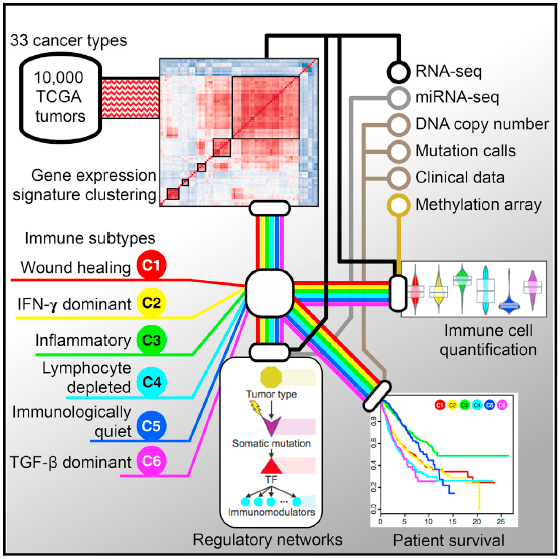 ffort with The Cancer Genome Atlas to construct a transcriptional regulatory network for 33 tumor types (https://portal.gdc.cancer.gov/). We are using immunomodulatory genes collected from the literature and association with estimated leukocyte fractions to discover immune-related biclusters from the 33 tumor types that were profiled by the TCGA (see figure below).
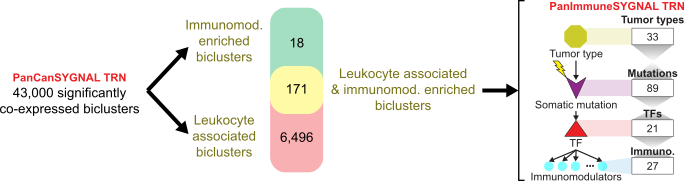
Constructing the SYGNAL PanImmune Network: SYGNAL PanImmune network was filtered to 43,000 significantly co-expressed biclusters. We then identified biclusters significantly associated with leukocyte infiltration (leukocyte-associated), biclusters enriched with IM genes, and biclusters with both associations. The final immune-related transcriptional regulatory network (TRN) was included 171 co-regulated biclusters that were either leukocyte-associated and/or immunomodulatory enriched biclusters. The resulting TRN is a predictive map with interactions from all 33 tumor types that implicate specific somatic mutations in modulating the expression of a TF(s) that in turn regulate IM gene(s) (within a bicluster). A summary of the counts for each feature in the PanImmuneSYGNAL TRN are shown on the left.
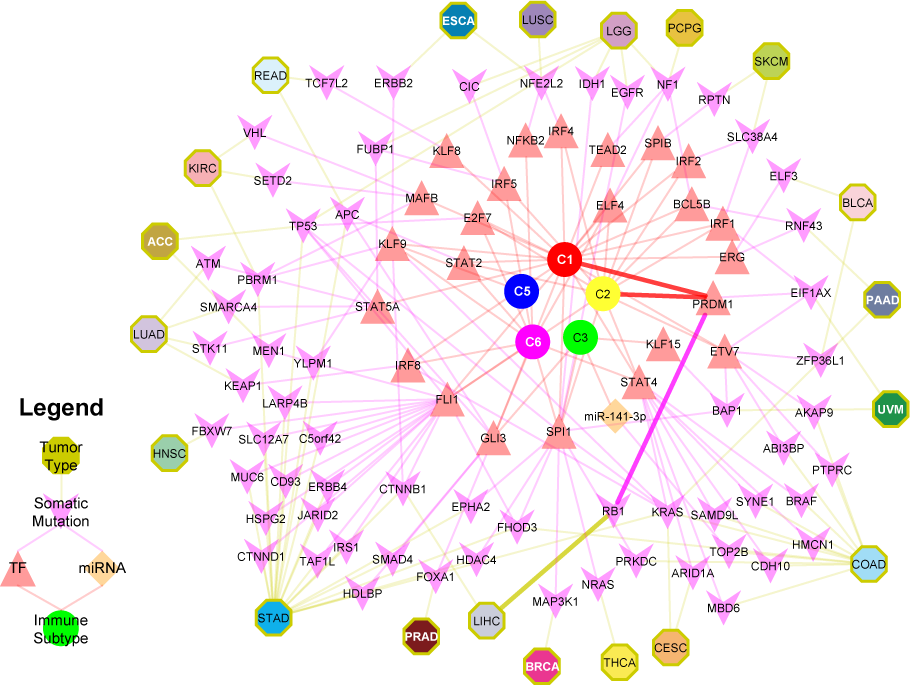
Regulators of immune subtypes from SYGNAL-PanImmune Network: Tumor types (octagons) linked through mutations (purple chevrons) to transcription factors (TFs, red triangles) and miRNAs (orange diamonds) that actively regulate the expression of IMs in biclusters associated with a single immune subtype (circles). The network describes predicted causal and mechanistic regulatory relationships linking tumor types through their somatic mutations (yellow edges) which causally modulate the activity of TFs and/or miRNAs (purple edges), which in turn regulate genes (not shown) whose expression is associated with an immune subtype (red edges). For example, RB1 mutations in LIHC (5% of patients) have significant evidence for causally modulating the activity of PRDM1 which in turn regulates genes associated (causal model at least 3 times as likely as alternative models and p-value < 0.05) with C1 and C2. Interactions for this path are bolded.
Mesothelioma
We are in the process of applying the SYGNAL pipeline to two multi-omic profiled cohorts of malignant pleural mesothelioma tumors (Buneo et al., 2016 Nat. Genet. , and TCGA). Having two multi-omic profiled cohorts provides a powerful platform for deciphering the underlying biological processes perturbed in malignant pleural mesothelioma.
- Collaboration with mesothelioma expert Dr. Chuong Hoang from the National Cancer Institute
Single cell regulatory networks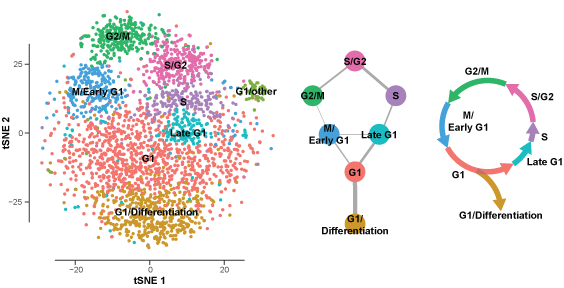
Given the highly heterogeneous nature of tumors both between patients and within a single patient’s tumor. Therefore we are developing tools to construct transcriptional regulatory networks from single cell RNA-seq omic profiles from patient tumors. Rational design of cancer therapeutics requires comprehensive knowledge of genetic diversity and the system of inter-cellular interactions within tumors. Tumors start with tumor-initiating cells and subsequent oncogenic mutations give rise to clonal subpopulations with different growth potentials. Averaging across this unevenly distributed tumor subpopulations masks signals from underrepresented subpopulations (green and gray subpopulations) leading to an incomplete characterization of the tumor. Until expanded to cover all of the genetic heterogeneity within tumors, designing therapeutics will be restricted to the predominant subpopulations (yellow and blue subpopulations). Even a targeted therapy cannot overcome the issues of recurrence if some minor drug-resistant subpopulations are spared and allowed to proliferate and re-establish heterogeneity. Alternatively, new up and coming single cell technologies will enable systems scale modeling and stratification of patient tumors into quantized cell populations. Knowledge of the expansive landscape of genetic variations within tumors will ultimately deliver personalized cancer therapeutics that will target all subpopulations to achieve a complete and durable response.
Immune response
Innate immune response to Mycobacterium tuberculosis infection
To assess the role of miRNAs in the regulation of the innate immune response, we characterized the transcriptional response of bone marrow-derived macrophages (BMMs) at 4, 8, 24, and 48 h following infection with Mtb and selected 3,473 differentially expressed genes based on the following criteria: Benjamini–Hochberg corrected Student’s t test P value ≤ 0.05 and fold-change ≥ 2. Using these differentially expressed genes, we discovered 11 distinct temporal gene expression signatures that underlie the macrophage transcriptional response to Mtb infection. We further characterized the clusters using Gene Ontology (GO) annotation; clusters 1–5 were comprised mainly of immune response genes and were up-regulated for the first 8 h and subsequently down-regulated. Clusters 6–11 were transiently down-regulated and were mainly comprised of genes involved in cellular proliferation. The identification of these clusters served as a basis for modeling miRNA regulation during the temporal waves of transcription.

Adaptive immune response to Mycobacterium tuberculosis infection
In close collaboration with the Urdahl Lab from the Center for Infectious Disease Research we are we characterizing the difference between chronic and acute stimulation by antigen across a time-series after peptide antigen stimulation. In this initial study we discovered 17 transcription factors as key drivers between ESAT6 and Ag85B antigen specific T cells. The TF Pbx3 was discovered to be up-regulated only in the chronically stimulated ESAT6 subsets when stimulated with ESAT6 peptide. This is of note because Pbx3 was previously discovered to be the most significantly up-regulated TF in exhausted T cells (Wherry, et al. 2007). The Urdahl lab is currently working to validate inferred regulatory relationships from this transcriptional regulatory network.
Stem cell differentiation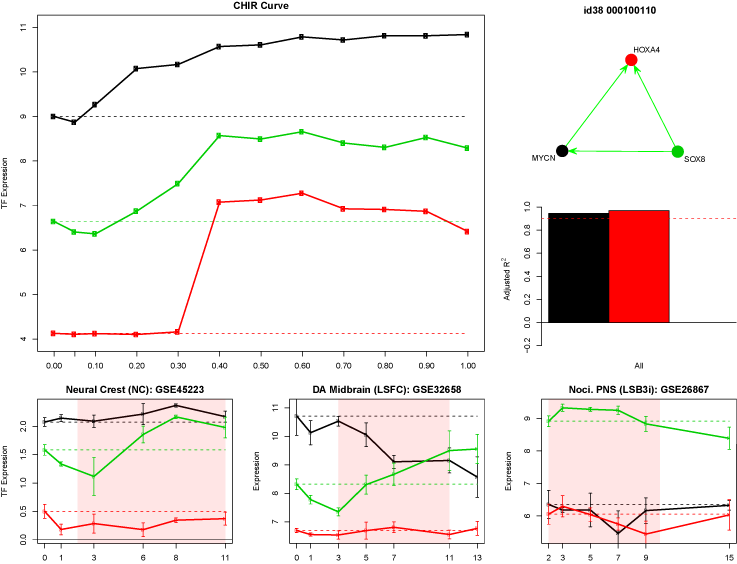
We constructed a gene regulatory network for the differentiation of embryonic stem cells (ESC) into dopamine neurons using a time course transcriptome profiling of three different differentiation culture conditions (Kriks, et al. 2011 Nature). Using this time course data it is possible to discover the evolved transcriptional regulatory network that leads to the differentiation of neurons. The regulatory factors identified by the SYGNAL pipeline significantly overlap with those found in the Kriks, et al. paper, and the regulatory factors driven by the different treatments coincide with known downstream regulators of the perturbed signalling processes. Future studies in the lab will demonstrate the accuracy and eventually describe the dynamics through the network topology that lead to the differentiation of neuronal cell types.